The Digital Backbone of England's Planning System: Understanding PS1 and PS2 Returns
Every three months, across England's 336 local planning authorities, a quiet but crucial administrative process unfolds. Planning officers compile detailed statistics about applications received, decisions made, and enforcement actions taken. These figures flow upward through the DELTA notification system to the Department for Levelling Up, Housing and Communities, forming the empirical foundation upon which national housing policy, planning reforms, and resource allocation decisions rest.
The PS1 and PS2 returns represent far more than mere bureaucratic box-ticking. They constitute the statistical nervous system of England's planning framework, capturing everything from major housing developments to tiny householder extensions, from permitted development conversions to enforcement notices served on unauthorised works. Without these quarterly snapshots, central government would be flying blind when setting housing targets, adjusting permitted development rights, or allocating planning delivery grants to struggling authorities.
Recent legislative changes have significantly expanded the scope of these returns. The proliferation of permitted development rights—particularly the controversial office-to-residential conversions and the new commercial-to-residential pathway introduced in August 2021—has necessitated increasingly granular data collection. Local authorities now track fourteen distinct categories of prior approval decisions, reflecting the government's determination to bypass traditional planning controls whilst monitoring the consequences.
Navigating the Quarterly Reporting Cycle: Timing and Responsibilities
The PS1 and PS2 reporting operates on a rigid quarterly schedule aligned with the government's financial year. Each quarter—April to June, July to September, October to December, and January to March—concludes with a mandatory submission deadline that local planning authorities cannot afford to miss. The Department for Levelling Up, Housing and Communities uses this data for parliamentary questions, policy evaluation, and the calculation of performance indicators that can affect future funding streams.
Within each local authority, responsibility typically falls to the development management team leader or a designated planning data officer. However, the compilation process requires input from multiple departments: development management for application statistics, planning enforcement for notices served, and building control for certain permitted development categories. This cross-departmental coordination often proves challenging, particularly in smaller district councils where officers wear multiple hats.
| Quarter Period | Data Collection Focus | Typical Submission Window | Key Challenges |
|---|---|---|---|
| April-June | Spring construction season applications | Early July | Bank holiday delays, officer leave |
| July-September | Summer peak development activity | Early October | Highest application volumes |
| October-December | Pre-winter decision clearance | Early January | Christmas closure impact on data |
| January-March | Financial year-end reconciliation | Early April | Budget setting pressures |
The quarterly rhythm creates particular pressure points. Authorities must balance the need for accurate data extraction against the operational demands of processing live applications. Many have developed automated reporting systems that pull statistics directly from case management software, though manual verification remains essential given the complexity of categorisation requirements.
Decoding the PS1 Structure: Applications, Decisions, and Enforcement Metrics
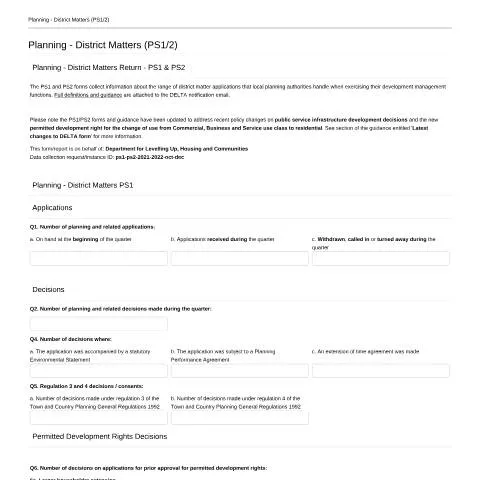
The PS1 form captures the operational heartbeat of local planning departments through eight main question blocks, each revealing different aspects of development management performance. Question 1 establishes the basic workflow metrics: applications on hand at quarter start, new applications received, and applications withdrawn or turned away. This seemingly simple data point actually reflects significant management decisions—authorities struggling with backlogs may encourage withdrawals to improve their statistics, whilst those with robust processes see fewer applicants walking away.
Questions 2 through 5 drill into decision-making patterns, with particular attention to applications accompanied by Environmental Statements, those subject to Planning Performance Agreements, and cases where time extensions were negotiated. The Environmental Statement indicator serves as a proxy for major development activity, whilst Planning Performance Agreement usage reflects an authority's sophistication in managing complex applications collaboratively rather than adversarially.
The most complex section—Question 6—has evolved dramatically since 2021 to accommodate the government's permitted development expansion. Originally covering just six categories, it now encompasses fourteen distinct types of prior approval decisions, from traditional householder extensions to the controversial new commercial-to-residential pathway. Each category requires authorities to distinguish between three outcomes: prior approval not required, granted, and refused.
The removal of the 'Prior approval not required' column for categories 6h through 6n reflects a fundamental shift in permitted development legislation—these newer rights operate under different legal frameworks where prior approval is always required if sought.
Questions 7 and 8 capture the broader regulatory landscape through certificates of lawful development and enforcement actions. The enforcement metrics—covering everything from formal notices to High Court injunctions—provide crucial intelligence about planning compliance patterns and the effectiveness of different enforcement approaches across England.
PS2 Deep Dive: Major Development Classification and Performance Tracking
Where PS1 captures operational statistics, PS2 focuses laser-like on development outcomes, categorising every planning decision by scale, type, and result. The form's tripartite structure—major developments excluding public service infrastructure, major public service infrastructure developments, and minor developments—reflects the government's recognition that different development types require distinct policy approaches and performance measures.
The major development categories reveal policy priorities embedded in statistical collection. Dwellings receive top billing in Question 1, reflecting the government's housing delivery obsession and the political sensitivity of approval rates for residential schemes. The separation of offices, research and development, and light industry in Question 2 acknowledges the economic development imperative whilst recognising these uses' different infrastructure and environmental impacts.
Question 7's focus on public service infrastructure developments—a category introduced to track hospitals, schools, prisons, and other essential facilities—demonstrates how statistical frameworks evolve to support specific policy agendas. These developments often face different planning considerations and public consultation requirements, making their separate tracking essential for infrastructure delivery planning.
The granted versus refused breakdown across all categories provides the raw material for national performance indicators. However, experienced planning officers know these statistics require careful interpretation—an authority with high refusal rates might demonstrate robust development standards rather than obstructionist tendencies, particularly if operating in environmentally sensitive areas or locations with severe infrastructure constraints.
Technical Completion Challenges: Data Extraction and Categorisation Complexities
Completing PS1 and PS2 returns demands more than simple number-crunching. Modern planning authorities typically manage thousands of applications annually through sophisticated case management systems, but extracting meaningful statistics requires understanding both the legal definitions underlying each category and the practical realities of how applications progress through the system.
The permitted development categories present particular challenges. Question 6h through 6n—covering various forms of upward building extensions—require officers to distinguish between seemingly similar development types based on subtle differences in building configuration and existing use. An application for building upwards on a commercial building could fall into category 6j (detached commercial buildings) or 6k (commercial buildings in a terrace), with significant implications for the statistical picture presented to government.
Timing complications add another layer of complexity. Applications received in one quarter but decided in the next create potential double-counting issues, whilst appeals, judicial reviews, and section 73 variations can muddy the waters between initial decisions and final outcomes. Many authorities maintain shadow spreadsheets alongside their main case management systems specifically to track PS1/PS2 categorisation decisions.
- Application dating: Should the receipt date or validation date determine quarterly allocation?
- Decision types: How to categorise approvals subject to legal agreements still being finalised?
- Enforcement overlaps: When planning contravention notices lead to retrospective applications
- Permitted development ambiguities: Applications spanning multiple categories or falling between definitions
- Withdrawal classifications: Distinguishing genuine withdrawals from applications "called in" by other authorities
The voluntary nature of questions 6h through 6o creates additional complications. Authorities lacking sophisticated data systems may struggle to extract these specific statistics, leading to potential under-reporting in the "All Others" category that could skew national policy analysis.
Administrative Processing and Quality Assurance Protocols
Once completed, PS1 and PS2 returns enter a multi-stage validation process designed to ensure data quality and consistency across England's diverse local authority landscape. The Department for Levelling Up, Housing and Communities employs both automated checks within the DELTA system and manual review processes to identify anomalies, inconsistencies, or significant variations from historical patterns.
Common validation triggers include mathematical inconsistencies (such as decisions exceeding applications received), dramatic quarter-on-quarter variations without obvious explanations, and zero returns in categories where activity would normally be expected. When flagged, authorities receive queries requiring written explanations and, where necessary, revised submissions.
The department maintains statistical profiles for each authority based on historical patterns, demographic characteristics, and development pressure indicators. An authority showing sudden spikes in major residential approvals or dramatic drops in enforcement activity will face scrutiny, particularly if the changes cannot be explained by known policy shifts or local circumstances.
Quality assurance extends beyond numerical accuracy to policy compliance. Recent returns have faced enhanced scrutiny regarding permitted development categorisation, reflecting government concerns about accurate monitoring of these controversial rights. Authorities showing unexpectedly high refusal rates for office-to-residential conversions may find themselves subject to detailed queries about their interpretation of prior approval criteria.
The feedback loop operates in both directions. Authorities experiencing difficulties with specific categorisations can request guidance, whilst the department uses common query patterns to refine form instructions and provide additional training materials. This iterative process has driven the evolution of PS1 and PS2 from relatively simple statistical returns into sophisticated policy monitoring instruments.
Policy Impact and Strategic Applications of PS1/PS2 Data
The quarterly flow of PS1 and PS2 data feeds directly into some of the most significant planning policy decisions affecting England's development landscape. Housing delivery test calculations, permitted development impact assessments, and local authority performance evaluations all depend heavily on the statistical picture these returns provide. Understanding this policy feedback mechanism helps explain why accurate completion matters far beyond administrative compliance.
The government's controversial permitted development programme relies almost entirely on PS1 data for impact monitoring. When office-to-residential conversions showed unexpectedly high take-up rates in early returns, this contributed to decisions to extend and expand these rights despite planning profession concerns. Conversely, low uptake figures for certain categories have influenced decisions to simplify procedures or expand permitted development scope.
Regional development patterns emerge clearly from aggregated PS1/PS2 data, informing infrastructure investment decisions and strategic planning guidance. Areas showing consistent high volumes of major development approvals but low delivery rates might indicate infrastructure capacity constraints requiring government intervention, whilst regions with declining application numbers could signal economic challenges requiring targeted support.
The enforcement statistics captured in PS1 Question 8 provide crucial intelligence about planning compliance patterns and the effectiveness of different enforcement approaches. Government reviews of enforcement policy, including recent consultations on enforcement powers and procedures, draw heavily on these statistics to identify where the system is working effectively and where reforms might be needed.
Parliamentary questions frequently reference PS1/PS2 statistics, making these humble quarterly returns a direct input into democratic accountability processes. Ministers rely on this data to defend policy decisions and respond to opposition challenges about planning system performance.
Future Evolution and Emerging Data Requirements
The PS1 and PS2 framework continues evolving in response to shifting policy priorities and emerging development trends. Recent additions—particularly the granular breakdown of permitted development categories—signal the government's determination to monitor policy impacts in real-time rather than relying on periodic reviews that might miss unintended consequences.
Climate change considerations are beginning to influence data collection priorities. Future iterations may include specific tracking of renewable energy applications, electric vehicle charging infrastructure, and developments incorporating sustainable drainage systems. The government's net-zero commitments will likely drive demand for statistics showing how the planning system supports or hinders decarbonisation efforts.
Digital planning initiatives may fundamentally transform PS1/PS2 completion processes. The government's commitment to digital-first planning services could enable real-time data extraction directly from standardised case management systems, eliminating manual compilation processes and enabling more frequent reporting cycles. However, this transition will require careful management to maintain data continuity and accommodate authorities at different stages of digital transformation.
The increasing complexity of development types—from build-to-rent schemes to co-living developments—challenges traditional categorisation approaches. Future PS1/PS2 iterations may require more nuanced classification systems that reflect contemporary development patterns whilst maintaining statistical continuity for trend analysis purposes.
Brexit implications continue emerging as the UK develops independent planning policy frameworks. PS1/PS2 data will likely play crucial roles in monitoring the effectiveness of distinctly British approaches to development management, providing evidence for future policy divergence from European models and supporting the government's "levelling up" agenda through detailed regional performance tracking.